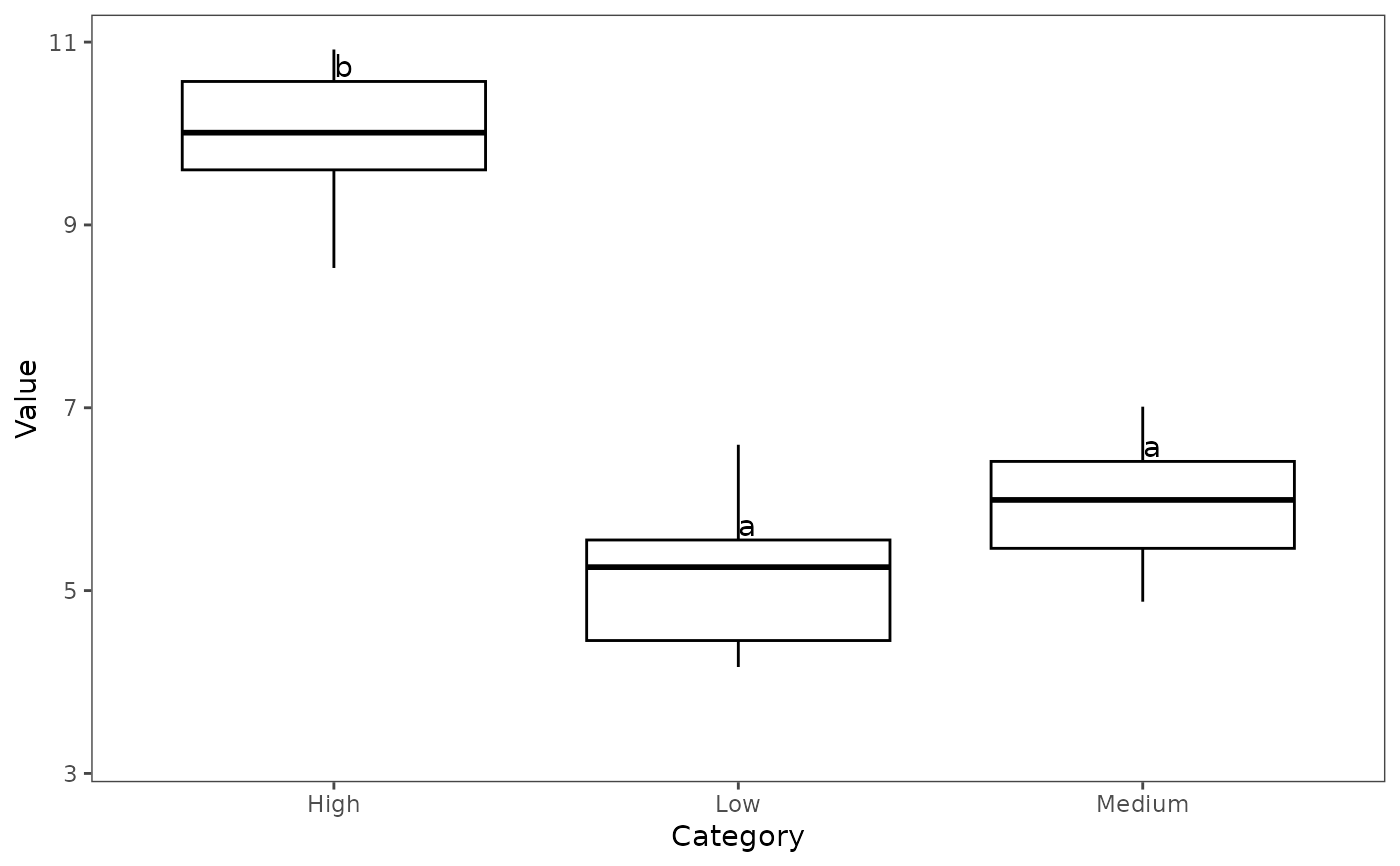
Performs pairwise comparisons using TukeyHSD and produces
boxplots with compact letter display showing significance pairwise differences.
Letters are produced by multcompLetters. Plots are
produced by ggplot2. Raw data can also be overlaid in
various ways according to the value of raw.
Usage
boxplot_letters(
  data,
  x,
  y,
  fill,
  group,
  test = c("tukey", "kruskalmc", "dunn"),
  type = c("two-way", "one-way"),
  where = c("box", "whisker", "mean", "median", "se", "sd", "cl_normal", "cl_boot"),
  raw = c("none", "points", "dots", "jitter"),
  pt_col = "slategray",
  hjust = 0,
  vjust = -0.2,
  lab_size = 4,
  na.rm = TRUE,
  threshold = 0.05,
  reversed = FALSE,
  ...
)
Arguments
- data
A data.frame in "long" format.
- x
variable to plot on x axis.
- y
variable to plot on y axis.
- fill
column or color to fill boxplots
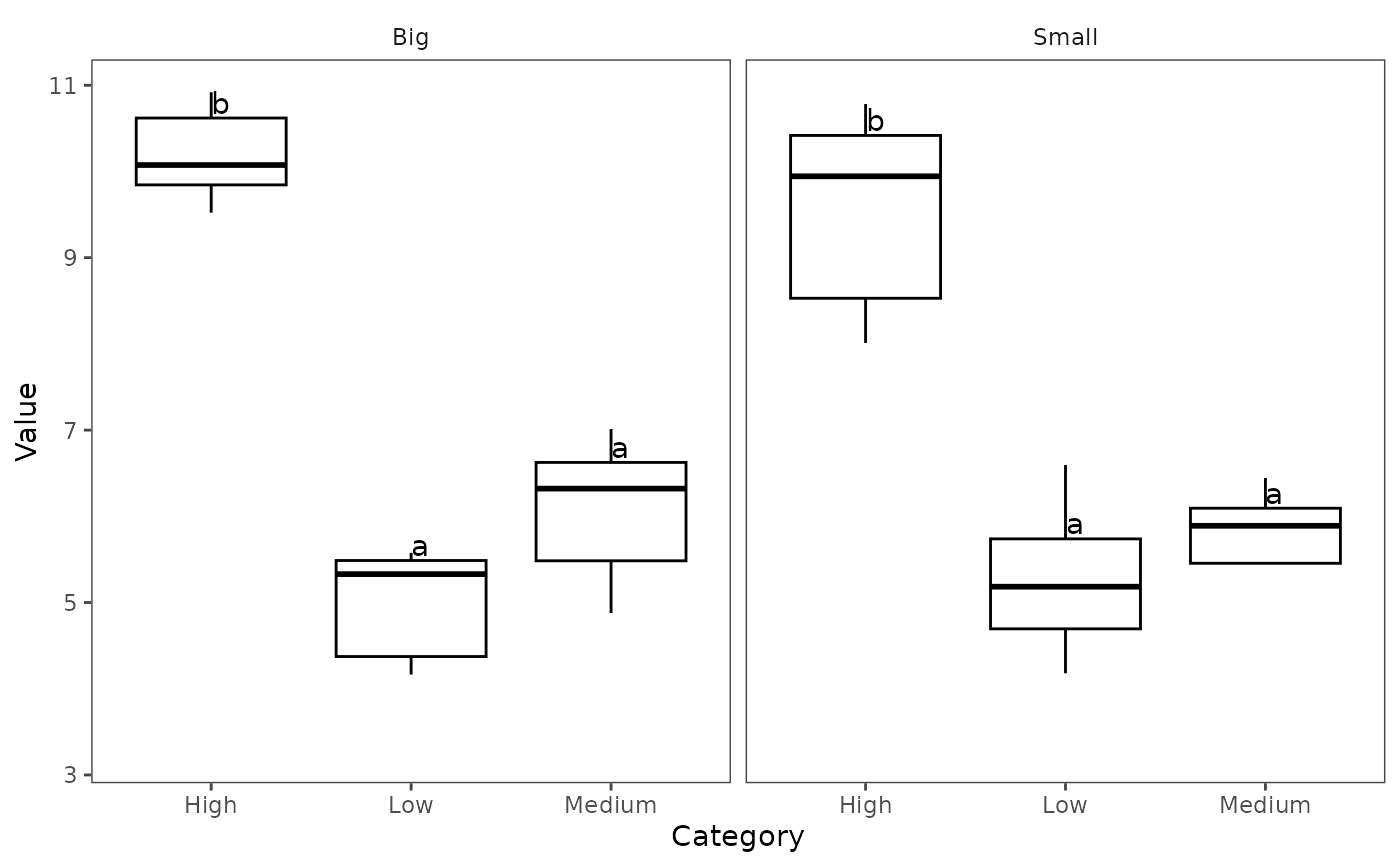
- group
A grouping variable (to allow faceting).
- test
Which test to run for pairwise comparisons. Either
tukey(the default),kruskalmc, ordunn_test.- type
If a grouping variable is provided, determines whether to run separate tests for each facet (
one-way) or a single (two-way) test (with an interaction term betweenxandgroup). Defaults totwo-way. This argument only applies if the Tukey test is selected, since there is no two-way Kruskal-Wallis test.- where
Where to put the letters. Either above the box (
box) or upper whisker (whisker) of a boxplot; at themeanormedianof the distribution; at the top of the error bars calculated from the standard error (se), standard deviationsd, or 95% confidence intervals returned byHmisc::smean.cl.normal()(cl_normal), orHmisc::smean.cl.boot()(cl_boot); or a fixed numeric y-position. A single number is recycled across all groups; a vector must have one value per group/facet, matching sorted group order.- raw
Whether to plot raw data and (if so), how. The current options are
none,geom_point,geom_dotplot, orgeom_jitter.- pt_col
Color of points, if raw data is plotted.
geom_dotplot, orgeom_jitter, according to the value ofraw.- hjust
Horizontal adjustment of label. Argument to
geom_text.- vjust
Vertical adjustment of label. Argument to
geom_text.- lab_size
Label size. Argument to
geom_text.- na.rm
Logical. Whether to remove observations with NAs for the provided factors (i.e.
xandgroup) before plotting.- threshold
Statistical threshold for significance. Defaults to 0.05.
- reversed
Logical. Argument to
multcompLetters3. Determines whether order of letters should be reversed. Defaults toFALSE.- ...
Additional arguments to
geom_point,
Note
Adapted from a helpful blog post by Justin Mathias.