Get compact letter display from a fitted model via emmeans
Source:R/tukey_letters.R
tukey_letters.RdGenerates a compact letter display (CLD) from any model type supported by
emmeans and returns a plain data frame suitable for
use with geom_text or geom_label.
Unlike geom_tukey, model fitting is left entirely to the user,
making this function suitable for mixed-effects models, GLMs, and other
complex model types.
Usage
tukey_letters(
  model,
  spec,
  data = NULL,
  by = NULL,
  where = "emmean",
  adjust = "tukey",
  threshold = 0.05,
  reversed = FALSE,
  Letters = letters
)
Arguments
- model
A fitted model object supported by
emmeans(e.g. fromlm,aov,lmer,glm).- spec
A one-sided formula specifying the factor to test, e.g.
~ species.- data
The data frame used to fit the model. Required when
whereis not"emmean".- by
Optional character vector of conditioning variables for faceted plots, passed to
emmeans. E.g.by = "sex"runs separate comparisons within each level ofsex.- where
Where to place the letters on the y axis. Either
"emmean"(default — uses the estimated marginal mean from the model), a numeric value for a fixed position, or any placement option fromgeom_tukey:"box","whisker","mean","median","se","sd","cl_normal","cl_boot"(the last two requireHmisc). All options other than"emmean"requiredatato be supplied.- adjust
P-value adjustment method passed to
contrast. Defaults to"tukey".- threshold
Significance threshold. Defaults to
0.05.- reversed
Logical. Whether to reverse letter order so that the group with the smallest mean is assigned
"a". Defaults toFALSE.- Letters
Character vector of symbols used to form the compact letter display. Defaults to
letters(a, b, c, …). PassLETTERSfor uppercase, or any other character vector for custom symbols (e.g. Greek letters).
Value
A data frame with one row per group (or per group × by
combination) containing the grouping columns, y (placement
position), and letter (the compact letter display string).
Examples
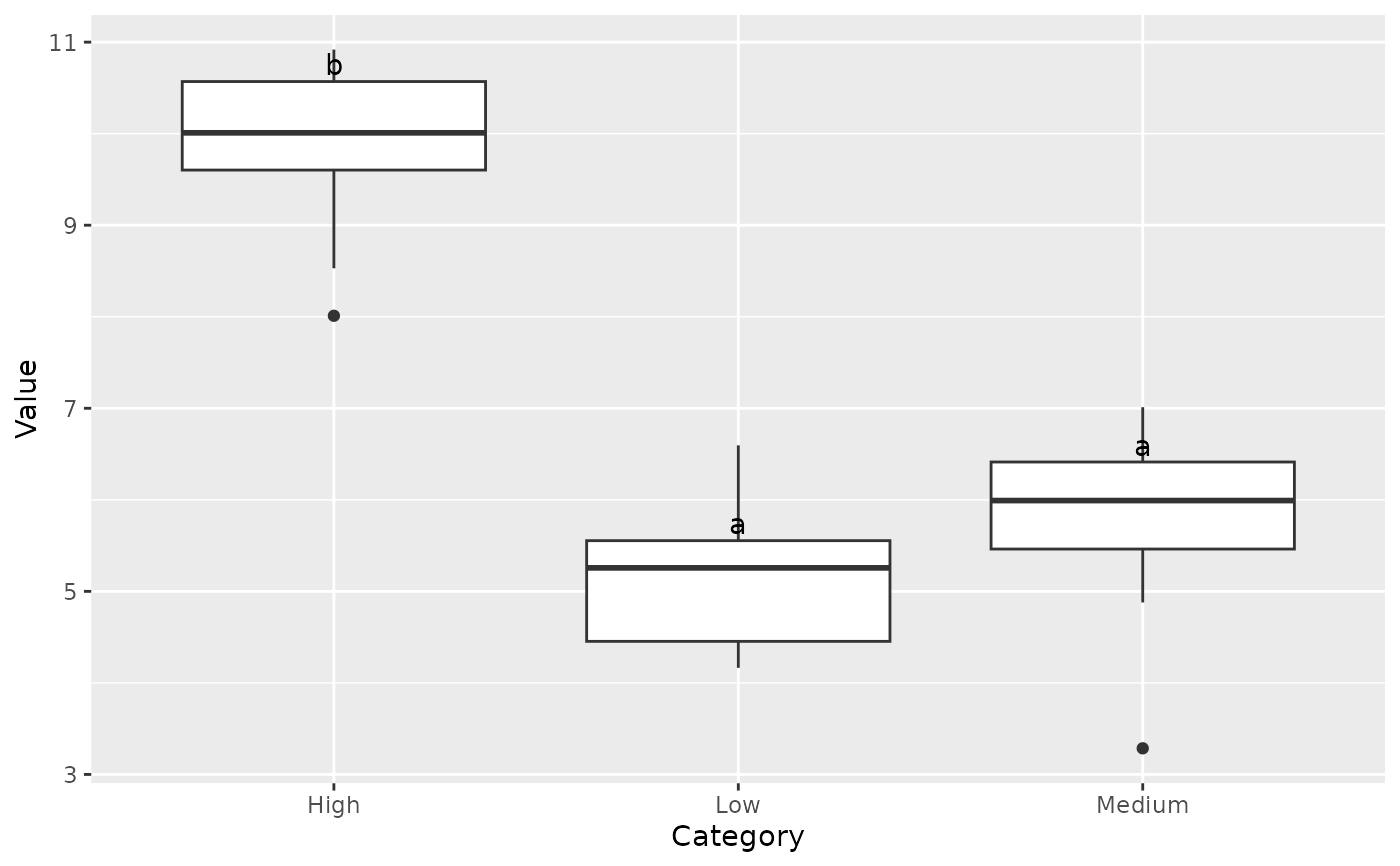
library(ggplot2)
set.seed(1)
data <- data.frame(
  Category = c(rep("Low", 10), rep("Medium", 10), rep("High", 10)),
  Value    = c(rnorm(10, 5), rnorm(10, 5.5), rnorm(10, 10))
)
mod <- lm(Value ~ Category, data = data)
if (requireNamespace("emmeans", quietly = TRUE)) {
  ldf <- tukey_letters(mod, ~ Category, data = data, where = "box")
  ggplot(data, aes(x = Category, y = Value)) +
    geom_boxplot() +
    geom_text(data = ldf, aes(x = Category, y = y, label = letter),
              vjust = -0.3)
}
#> Note: adjust = "tukey" was changed to "sidak"
#> because "tukey" is only appropriate for one set of pairwise comparisons