Ethan Bass


Software

Some software tools I developed during my PhD to facilitate easier and more reproducible analysis of chemical data.

chromatographR : Chromatographic Data Analysis Toolset Github
DOI total downloads monthly downloads
chromatographR provides a set of tools for flexibly and reproducibly analyzing HPLC-DAD data or other "simple" chromatographic data (e.g. HPLC-UV, GC-FID) in R. Includes functions for preprocessing, alignment, peak-finding and fitting, peak-table construction, data-visualization, etc. For an example workflow, see the vignette.

chromatographR logo


chromConverter : Chromatographic File Converter Github
DOI total downloads monthly downloads
chromConverter reads chromatograms from a variety of proprietary formats into R objects. It currently supports conversion of 'Agilent ChemStation', 'Agilent MassHunter', and 'ThermoRaw' files as well as various text-based formats. In addition to its internal file parsers, chromConverter provides a simple programmatic interface to file parsers from several external libraries, such as Aston, Entab, OpenChrom, rainbow, and the ThermoRawFileParser.

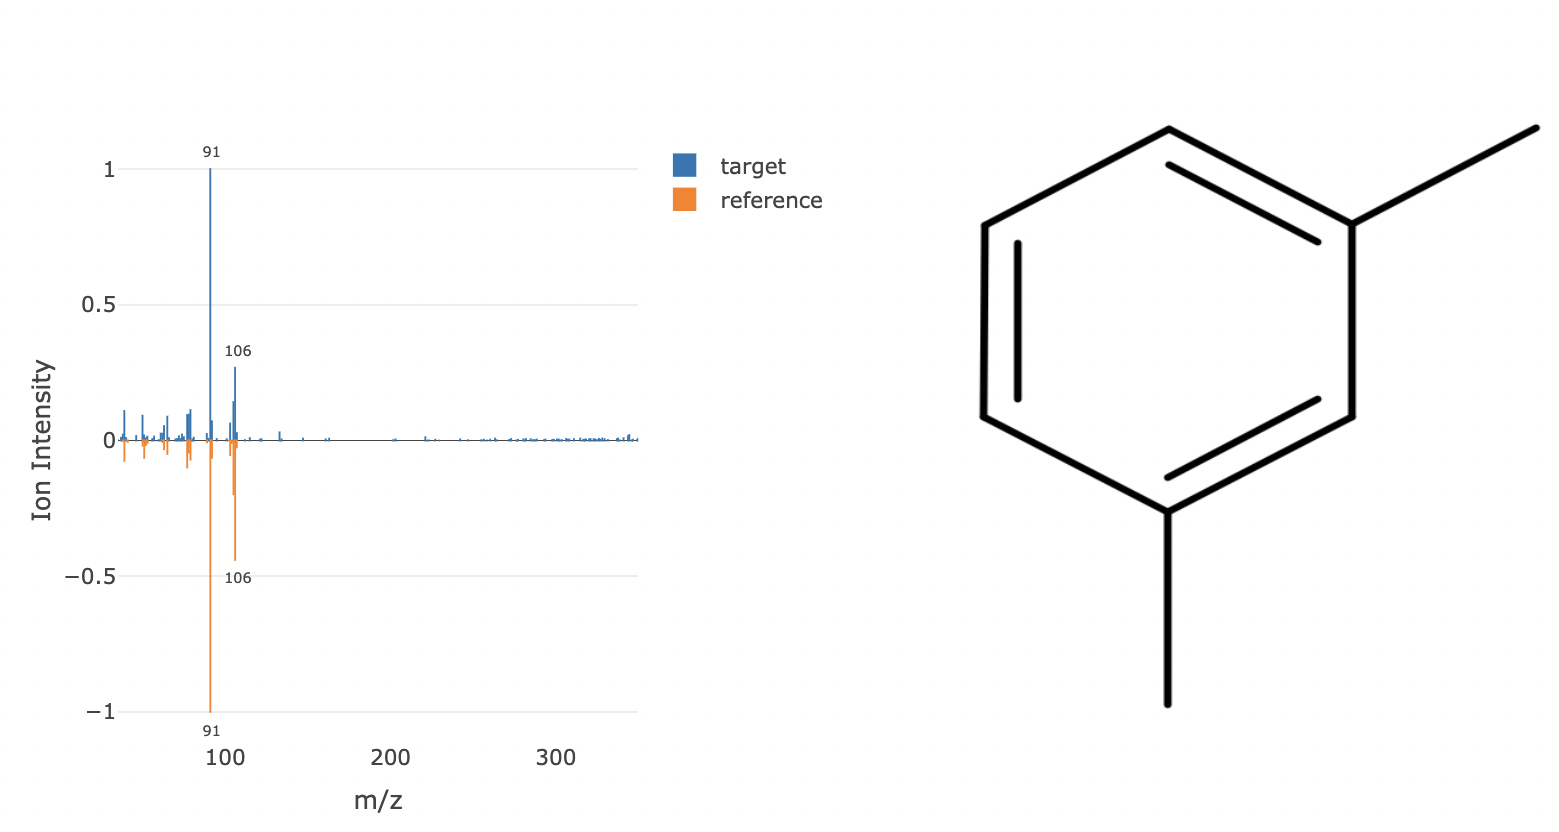
mzinspectr: Read and Analyze Mass Spectrometry Alignment Files . Github
r-universe badge stability badge
There are many wonderful open source tools for analyzing mass spectrometry data like MS-DIAL and MZmine, however these tools are not as flexible as R for downstream statistical analyses of the resulting feature tables. Rather than re-inventing the wheel, I wanted a tool that could be used to flexibly analyze MS alignments in R. The mzinspectr package makes it easy to import feature tables from other programs for further processing and analysis in R. It includes functions for normalization, feature identification, and visualization of spectra.


ggtukey: Compact Letter Displays for 'ggplot2' . Github
r-universe badge stability badge
The ggtukey package provides a simple way to visualize paired comparisons by adding compact letter displays to 'ggplot2' figures. The example shows differences in body mass between penguin species, using data from the palmerpenguins package. To get started, visit the vignette.

zerenebatchR: Utility for Batch Processing Images in Zerene Stacker . Github
r-universe badge stability badge
zerenebatchR is a utility I made in R to facilitate easier stacking of photos with Zerene Stacker . I use it mainly for stacking pictures of mycorrhizal hyphae (as pictured on the right) and root structures to measure the performance of mycorrhizae.

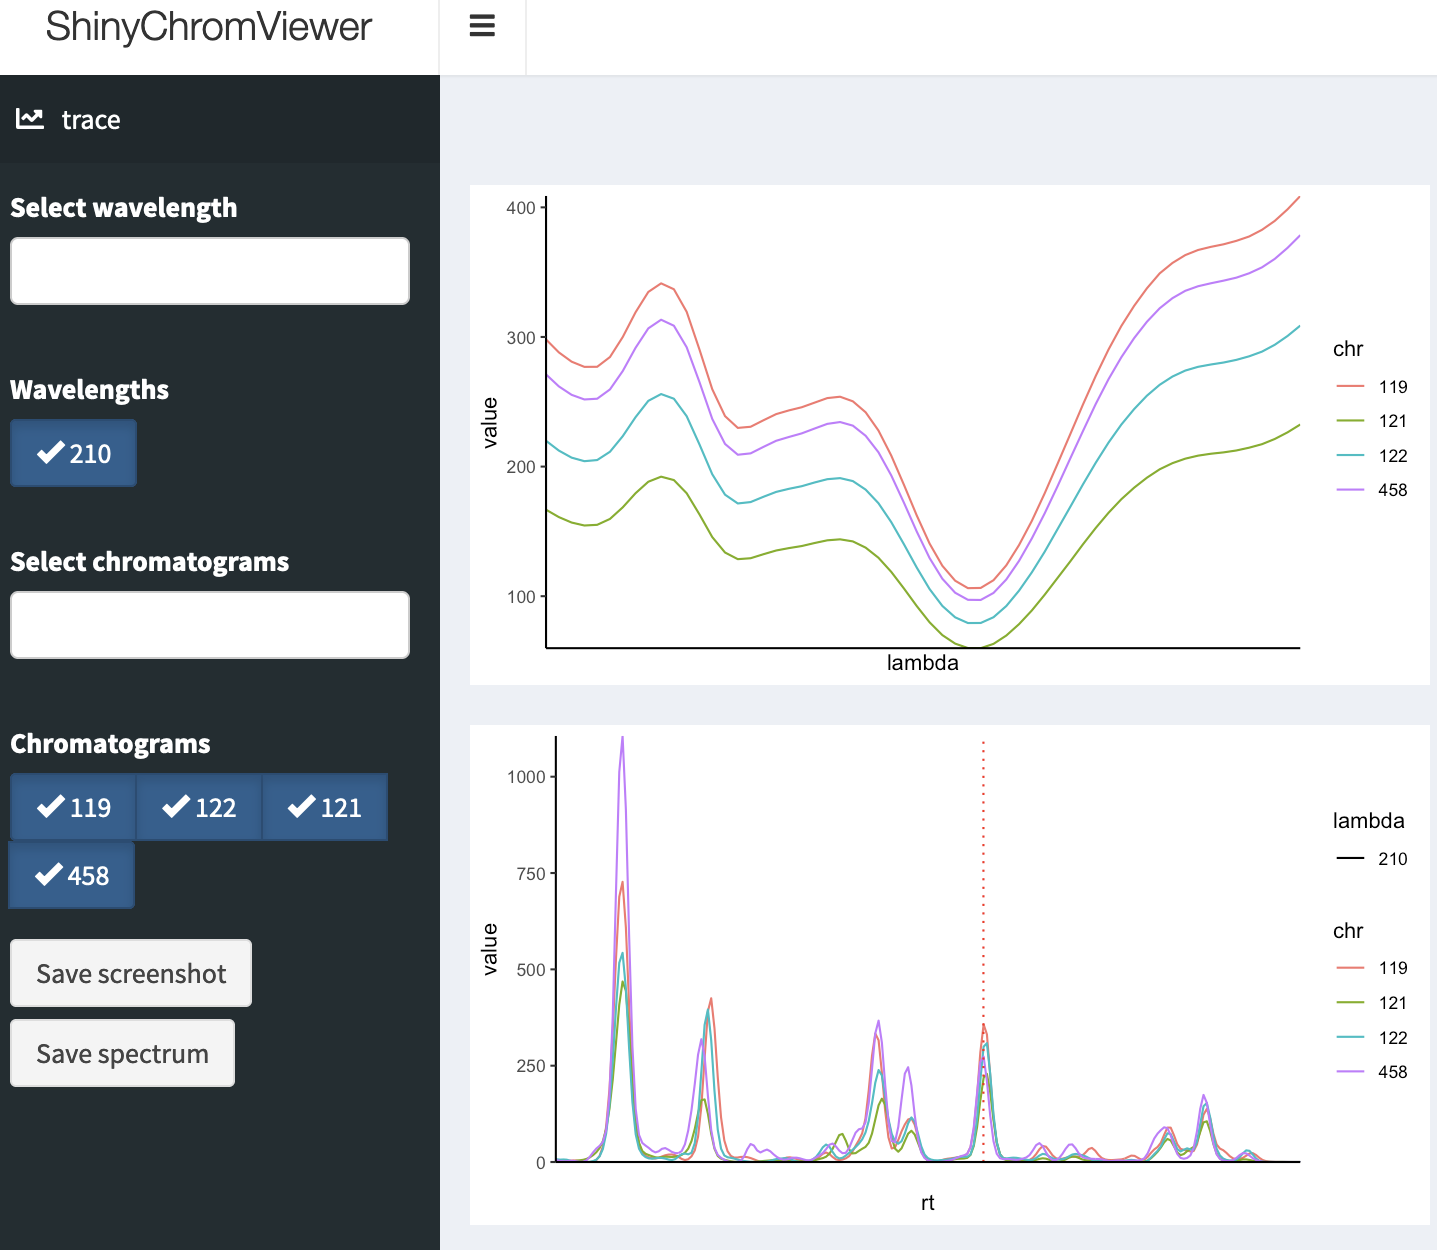
ShinyChromViewer: Shiny Gadget for Interactive Viewing and Exploration of Chromatograms . Github
r-universe badge stability badge
A Shiny app for interactively viewing HPLC-DAD chromatograms in R.

Maintainer

VPdtw: Variable Penalty Dynamic Time Warping . Github
cran badge total downloads monthly downloads
I am also the current maintainer of the VPdtw: Variable Penalty Dynamic Time Warping, originally developed by David Clifford and Glenn Stone . I rescued this package from the CRAN archive and now use it as one of the options in chromatographR for aligning chromatograms.

Contributor

I have also contributed code to several other open source software projects:

webchem: Chemical Information from the Web Github
RaMS: R-based access to Mass-Spectrometry data
Entab: * -> TSV