Plot a chromatogram or chromatograms with an inset UV spectrum
Source:R/plot_spectrum.R
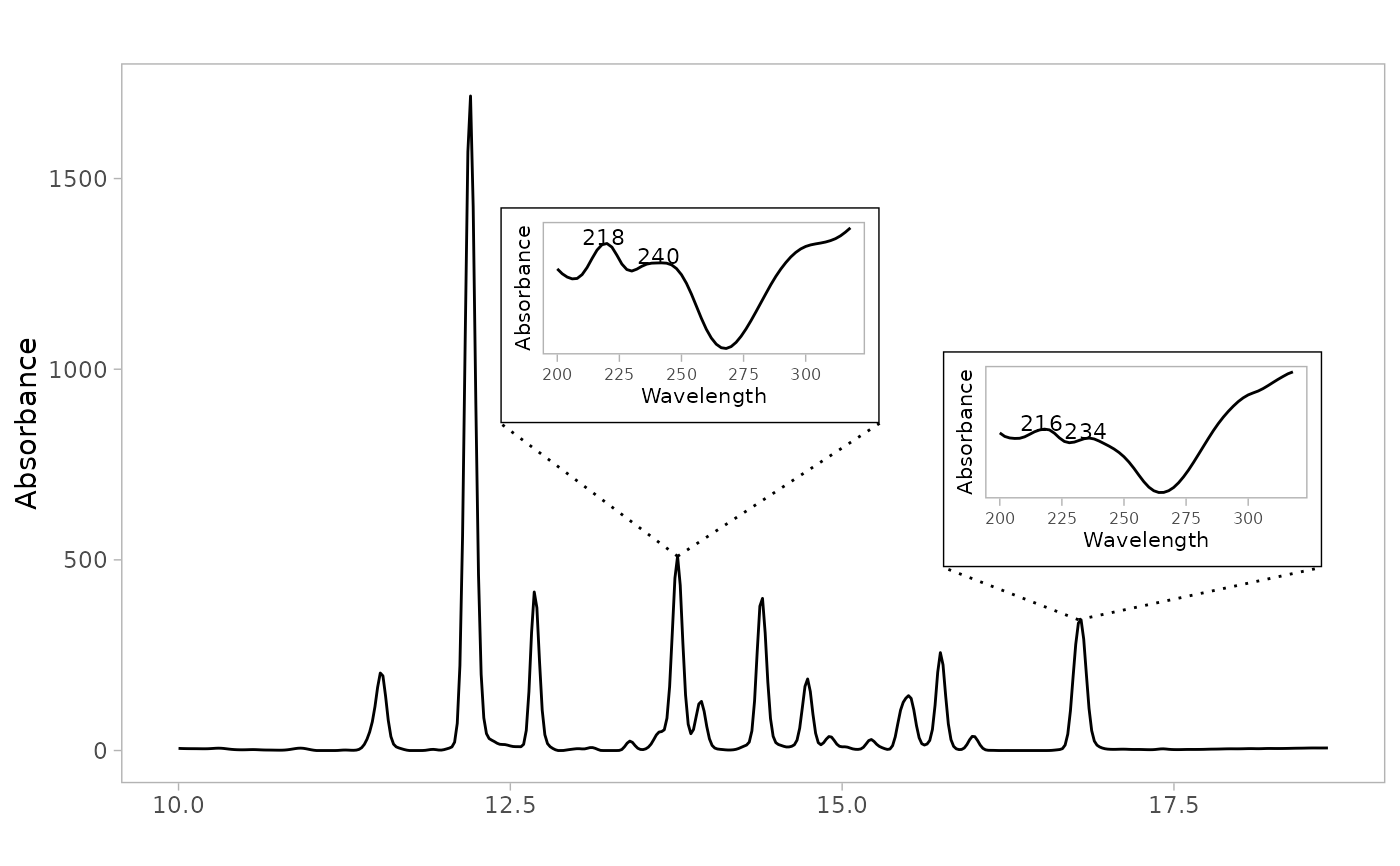
plot_spectrum_inset.RdPlots a chromatogram (either a single trace or multiple traces) with an inset UV spectrum for a specified peak. Dotted lines connect the peak apex to the two nearest corners of the inset box.
Usage
plot_spectrum_inset(
  loc,
  peak_table,
  chrom_list = NULL,
  idx = "max",
  lambda = "max",
  position = "topright",
  inset_width = 0.35,
  inset_height = 0.35,
  ylim = NULL,
  xlim = NULL,
  engine = "ggplot",
  scale_spectrum = TRUE,
  verbose = getOption("verbose"),
  inset_text_size = 8,
  ...
)
Arguments
- loc
Peak name or vector of names in the peak table (e.g.
"V10").- peak_table
A
peak_tableobject created byget_peaktable.- chrom_list
A list of chromatograms in matrix format (timepoints × wavelengths). If no argument is provided here, the function will try to find the
chrom_listobject using the pointer in thepeak_table.- idx
Index of chromatogram(s) to plot. If
"max"(default) or a scalar, plots a single trace, and the inset shows its spectrum. If a vector, plots one trace per chromatogram, and the inset overlays their spectra.- lambda
Wavelength to use for the chromatographic trace and for locating the peak apex. Either a numeric value or
"max"(default) to use the wavelength of maximum absorbance.- position
Position of the inset. One of
"topright"(default),"topleft","top","left", or"right". Alternatively, a numeric vector of length 2 giving the proportional coordinates of the bottom-left corner, e.g.,c(0.6, 0.6), used together withinset_widthandinset_height. Whenlocnames several peaks, a list with one position per peak.- inset_width
Width of the inset as a proportion of the plot width. Defaults to
0.35.- inset_height
Height of the inset as a proportion of the plot height. Defaults to
0.35.- ylim
Y axis limits for the main plot. Passed to
plot_chroms().- xlim
X axis limits for the main plot. Passed to
plot_chroms().- engine
Plotting engine. Currently only
"ggplot"is supported.- scale_spectrum
Logical. If
TRUE(the default), scales the inset spectrum to unit height.- verbose
Logical. If
TRUE, prints the index and name of each chromatogram plotted, with its retention time, wavelength and absorbance. Defaults togetOption("verbose").- inset_text_size
Base size for text elements in inset. Defaults to
8.- ...
Additional arguments passed to
plot_chroms().
Examples
if (requireNamespace("ggplot2", quietly = TRUE)) {
  data(pk_tab)
  data(Sa_warp)
  # single trace with inset spectrum
  plot_spectrum_inset("V13", peak_table = pk_tab)

  # multiple traces, inset in the center
  plot_spectrum_inset("V13", peak_table = pk_tab, idx=c(1:4),
  position = "top")

  # manual inset placement
  plot_spectrum_inset("V13", peak_table = pk_tab,
                      position = c(0.6, 0.3),
                      inset_width = 0.35, inset_height = 0.25)

  # multiple peaks with a list of positions
  plot_spectrum_inset(c("V13", "V25"), peak_table = pk_tab,
                      position = list(c(0.3, 0.5), c(0.65, 0.3)),
                      inset_width = 0.3, inset_height = 0.3)
                      }