Plots the specified traces from a list of chromatograms.
Usage
plot_chroms(
  x,
  lambdas,
  idx,
  xlim = NULL,
  ylim = NULL,
  xlab = "",
  ylab = "Absorbance",
  engine = c("base", "ggplot", "plotly"),
  linewidth = 1,
  show_legend = TRUE,
  legend_position = "topright",
  title = "",
  ...
)
Arguments
- x
A list of chromatograms in matrix format (timepoints x wavelengths).
- lambdas
A character or numeric vector specifying the wavelengths to plot.
- idx
A vector representing the names or numerical indices of the chromatograms to plot.
- xlim
Range of x axis.
- ylim
Range of y axis.
- xlab
X label.
- ylab
Y label. Defaults to "Absorbance".
- engine
- linewidth
Line width.
- show_legend
Logical. Whether to display legend or not. Defaults to TRUE.
- legend_position
Position of legend.
- title
Title for plot.
- ...
Additional arguments to plotting function specified by
engine.
Side effects
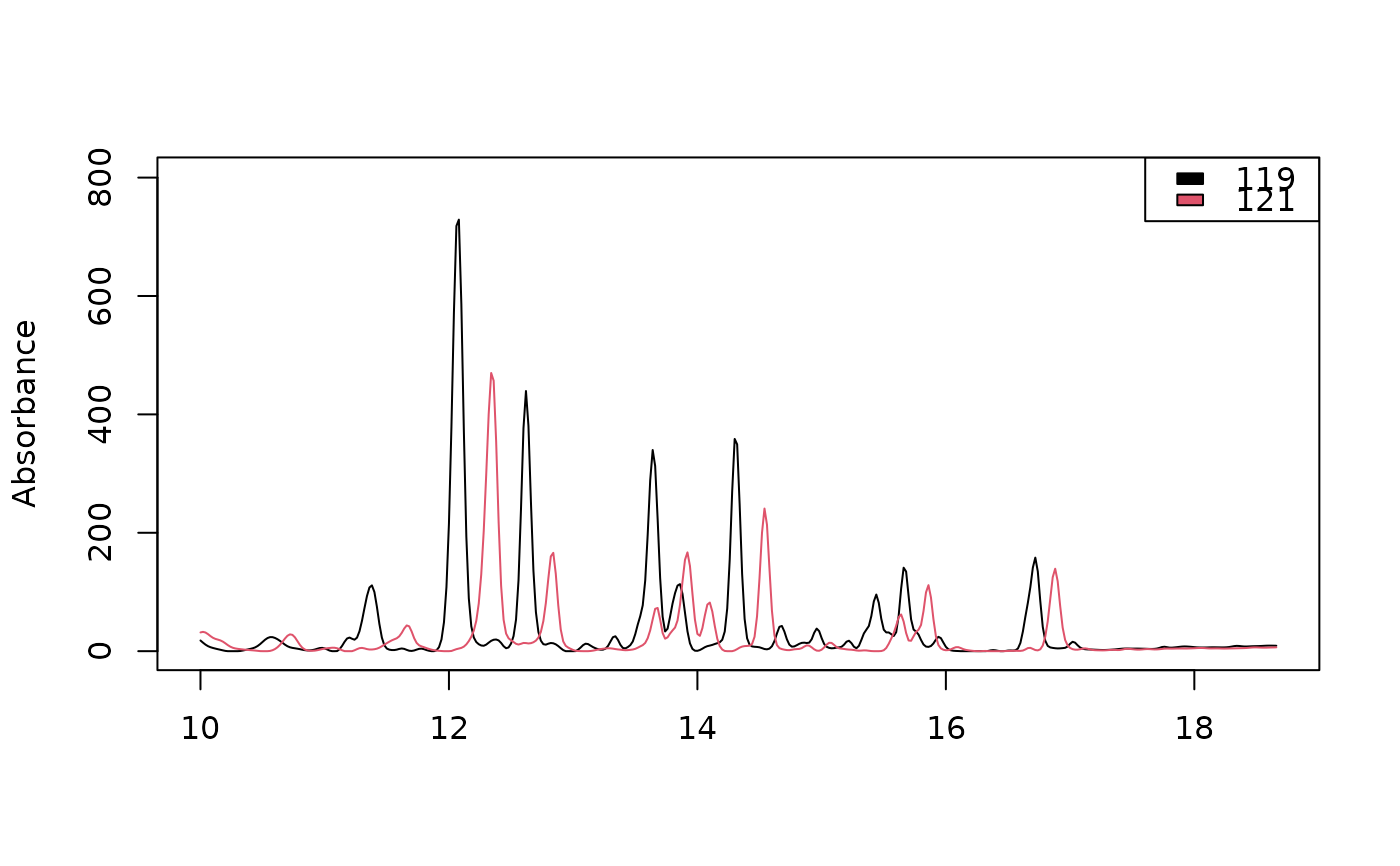
Plots the traces of the specified chromatograms idx at the specified
wavelengths lambdas. Plots can be produced using base graphics, ggplot2,
or plotly, according to the value of engine.
See also
Other visualization functions:
boxplot.peak_table(),
mirror_plot(),
plot.peak_list(),
plot.peak_table(),
plot_all_spectra(),
plot_chroms_heatmap(),
plot_spectrum(),
scan_chrom()
Examples
data(Sa_warp)
plot_chroms(Sa_warp, lambdas = 210)