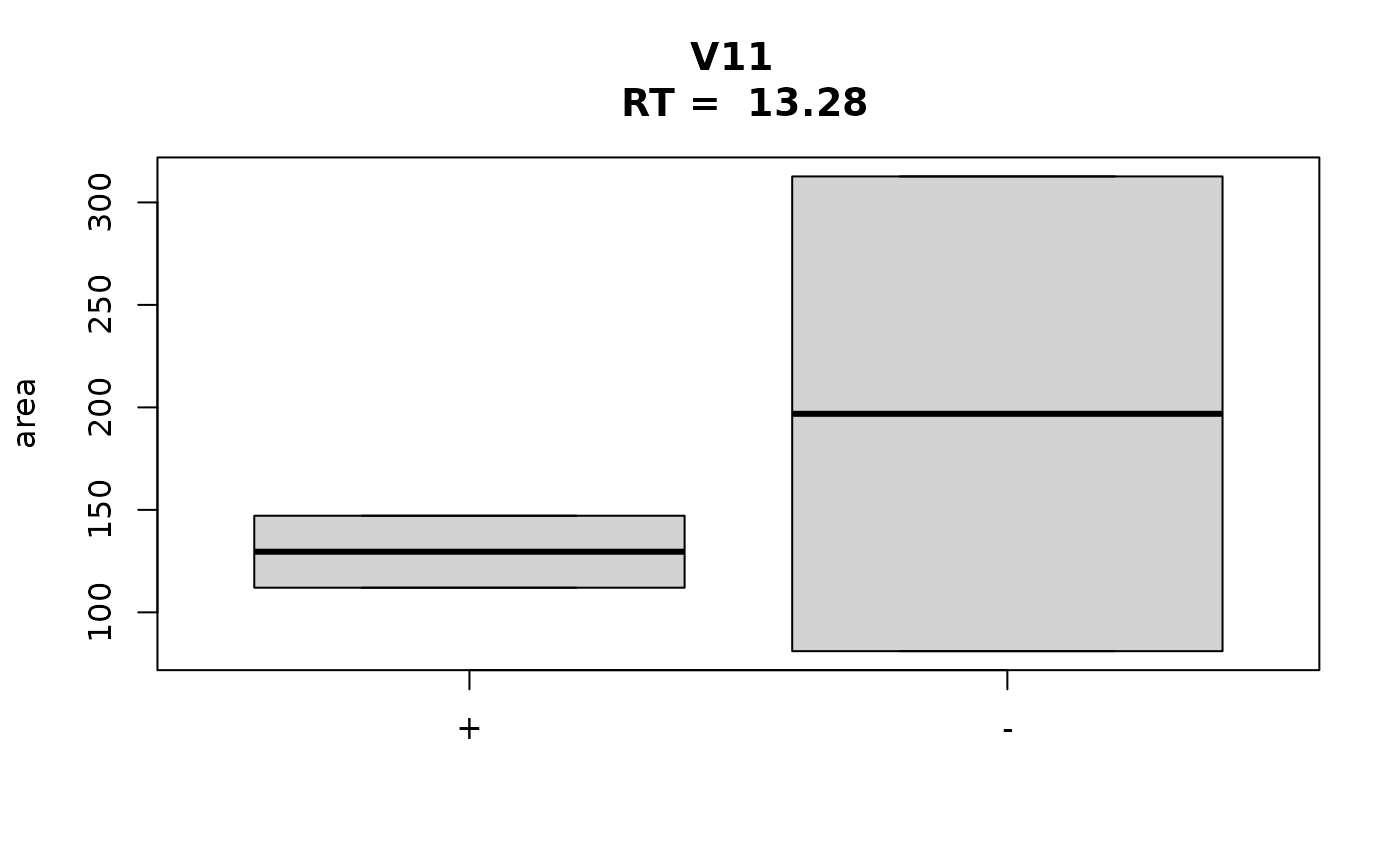
The function can take multiple response variables on the left hand side of the
formula (separated by +). In this case, a separate boxplot will be
produced for each response variable.
Usage
# S3 method for class 'peak_table'
boxplot(x, formula, ...)See also
Other visualization functions:
mirror_plot(),
plot.peak_list(),
plot.peak_table(),
plot_all_spectra(),
plot_chroms(),
plot_chroms_heatmap(),
plot_spectrum(),
scan_chrom()
Examples
data(pk_tab)
path <- system.file("extdata", "Sa_metadata.csv", package = "chromatographR")
meta <- read.csv(path)
pk_tab <- attach_metadata(peak_table = pk_tab, metadata = meta, column="vial")
boxplot(pk_tab, formula=V11 ~ trt)

