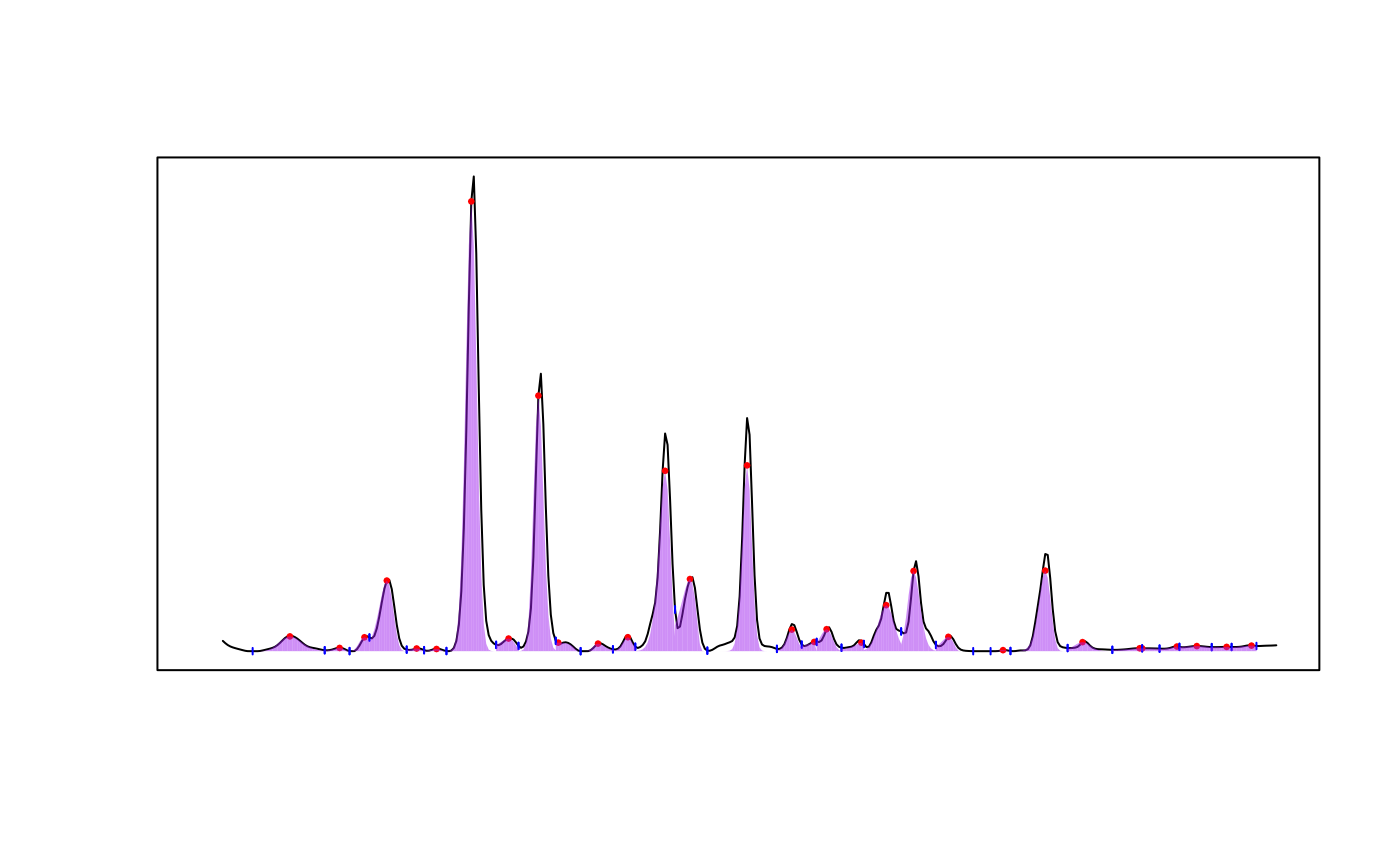
Visually assess integration accuracy by plotting fitted peaks over trace.
Usage
# S3 method for class 'peak_list'
plot(
  x,
  ...,
  chrom_list,
  idx = 1,
  lambda = NULL,
  points = FALSE,
  ticks = FALSE,
  a = 0.5,
  color = NULL,
  cex.points = 0.5,
  numbers = FALSE,
  cex.font = 0.5,
  y.offset = 25,
  plot_purity = FALSE,
  res,
  index = NULL
)
Arguments
- x
A
peak_listobject. Output from theget_peaksfunction.- ...
Additional arguments to main plot function.
- chrom_list
List of chromatograms (retention time x wavelength matrices)
- idx
Index or name of chromatogram to be plotted.
- lambda
Wavelength for plotting.
- points
Logical. If TRUE, plot peak maxima. Defaults to FALSE.
- ticks
Logical. If TRUE, mark beginning and end of each peak. Defaults to FALSE.
- a
Alpha parameter controlling the transparency of fitted shapes.
- color
The color of the fitted shapes.
- cex.points
Size of points. Defaults to 0.5
- numbers
Whether to number peaks. Defaults to FALSE.
- cex.font
Font size if peaks are numbered. Defaults to 0.5.
- y.offset
Y offset for peak numbers. Defaults to 25.
- plot_purity
Whether to add visualization of peak purity.
- res
time resolution for peak fitting
- index
This argument is deprecated. Please use
idxinstead.
Side effects
Plots a chromatographic trace from the specified chromatogram (chr)
at the specified wavelength (lambda) with fitted peak shapes from the
provided peak_list drawn underneath the curve.
See also
Other visualization functions:
boxplot.peak_table(),
mirror_plot(),
plot.peak_table(),
plot_all_spectra(),
plot_chroms(),
plot_chroms_heatmap(),
plot_spectrum(),
scan_chrom()