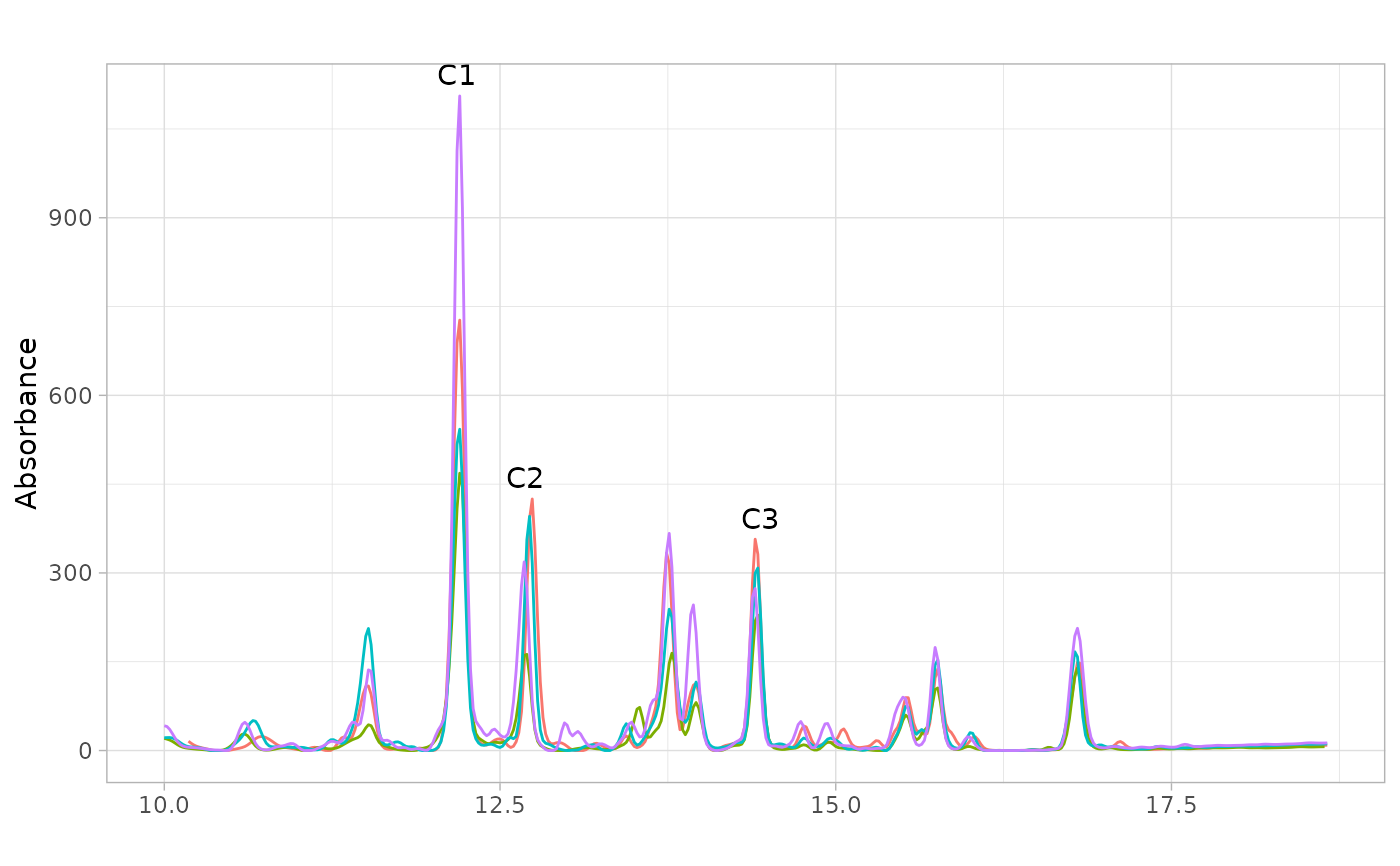
Adds text labels to peaks on a chromatogram plot produced by
plot_chroms(). Peaks named in a peak table are labeled at their
retention time, above the highest point of the chromatograms in idx
between the peak's start and end. Peaks given as retention times are
labeled at that time, above the highest plotted point within tol of it,
and need no peak table; the label then marks the tallest trace in that
window, whichever peak it belongs to.
Usage
annotate_peaks(
  p,
  loc,
  peak_table = NULL,
  chrom_list = NULL,
  label = NULL,
  lambda = NULL,
  idx = NULL,
  tol = 0.05,
  vjust = -0.5,
  ...
)
Arguments
- p
A
ggplotobject produced byplot_chroms().- loc
Either a character vector of peak names from
peak_table(e.g.c("V8", "V15")) or a numeric vector of retention times, in the units of the plot's time axis. If named, the names are used as labels.- peak_table
A
peak_tableobject created byget_peaktable. Required whenlocgives peak names.- chrom_list
A list of chromatograms in matrix format (timepoints × wavelengths). If no argument is provided here, the function will try to find the
chrom_listobject using the pointer in thepeak_table.- label
Labels to display at each peak. Can be a character vector of labels (one per peak), or
"rt"to use the retention times. If labels are not specified here, the names oflocwill be applied, or if thelocvector is not named, the peak names will be used directly.- lambda
Wavelength(s) to use for locating the peak apex. Inherited from
pifNULL(default). If multiple wavelengths are provided, the one with the highest absorbance at the peak's retention time is used.- idx
Index of chromatogram(s) to use for locating the peak apex. Inherited from
pifNULL(default).lambdaandidxapply only to peak names; retention times use the plotted traces.- tol
Half-width of the window around each retention time in which the highest plotted point is found, in minutes. Defaults to
0.05. Ignored for peak names.- vjust
Vertical justification of the label relative to the peak apex. Defaults to
-0.5.- ...
Additional arguments passed to
ggplot2::annotate().
Examples
if (requireNamespace("ggplot2", quietly = TRUE)) {
  data(Sa_warp)
  data(pk_tab)
  plot_chroms(Sa_warp, lambdas = 210, engine = "ggplot") |>
    annotate_peaks(c(C1="V7", C2="V9", C3="V15"), peak_table = pk_tab)
  plot_chroms(Sa_warp, lambdas = 210, engine = "ggplot") |>
    annotate_peaks(c(C1 = 12.18, C2 = 12.70))
}