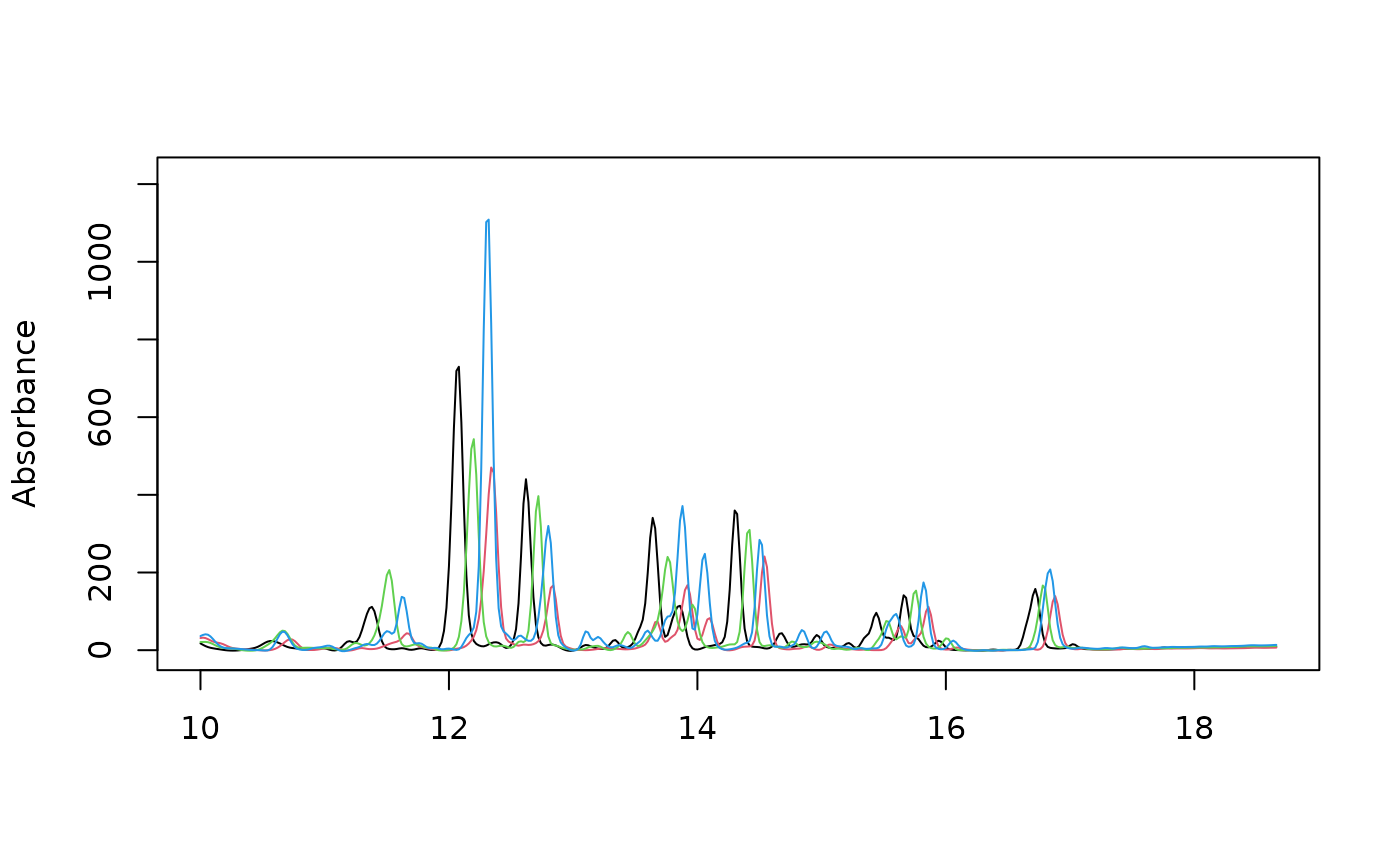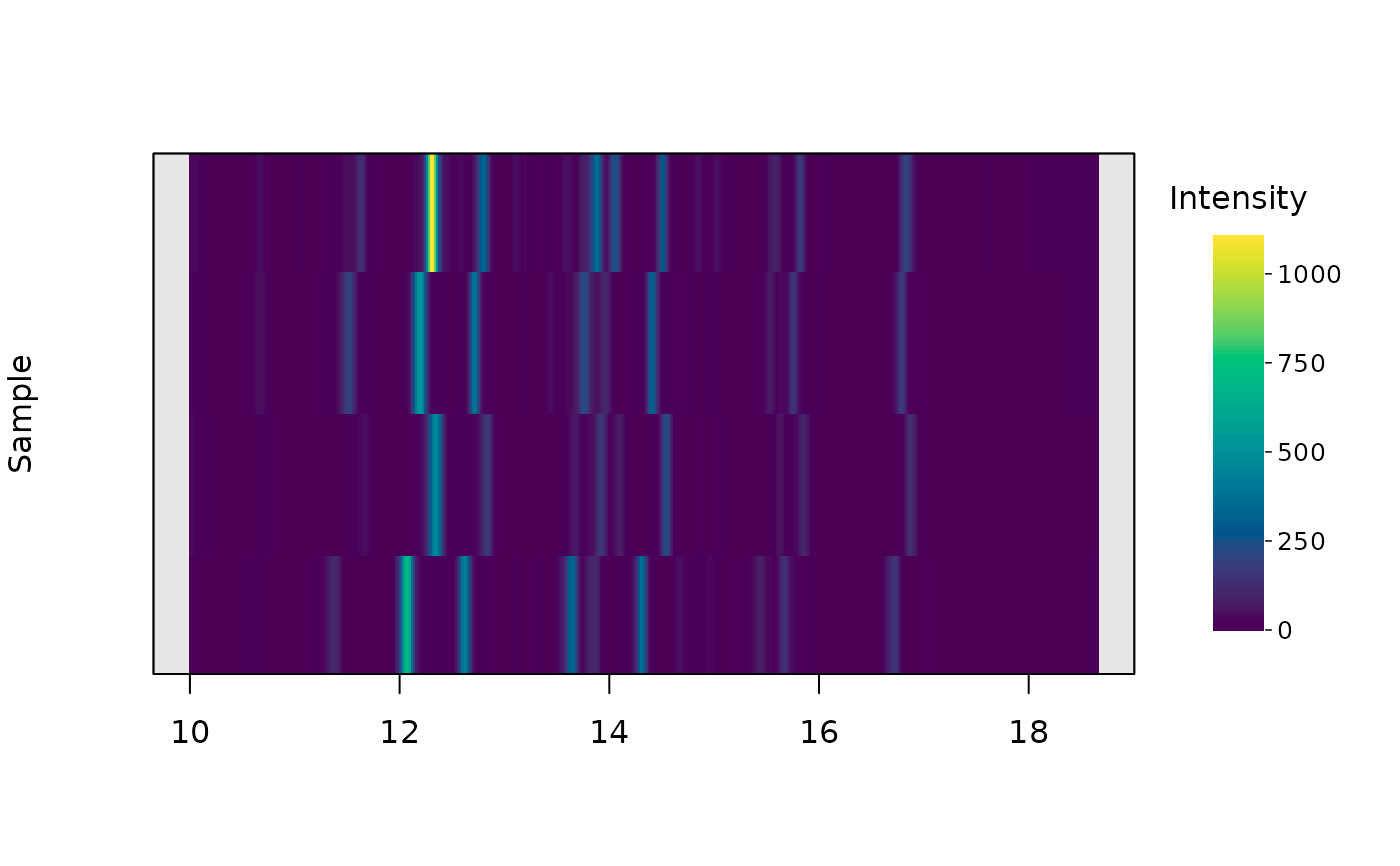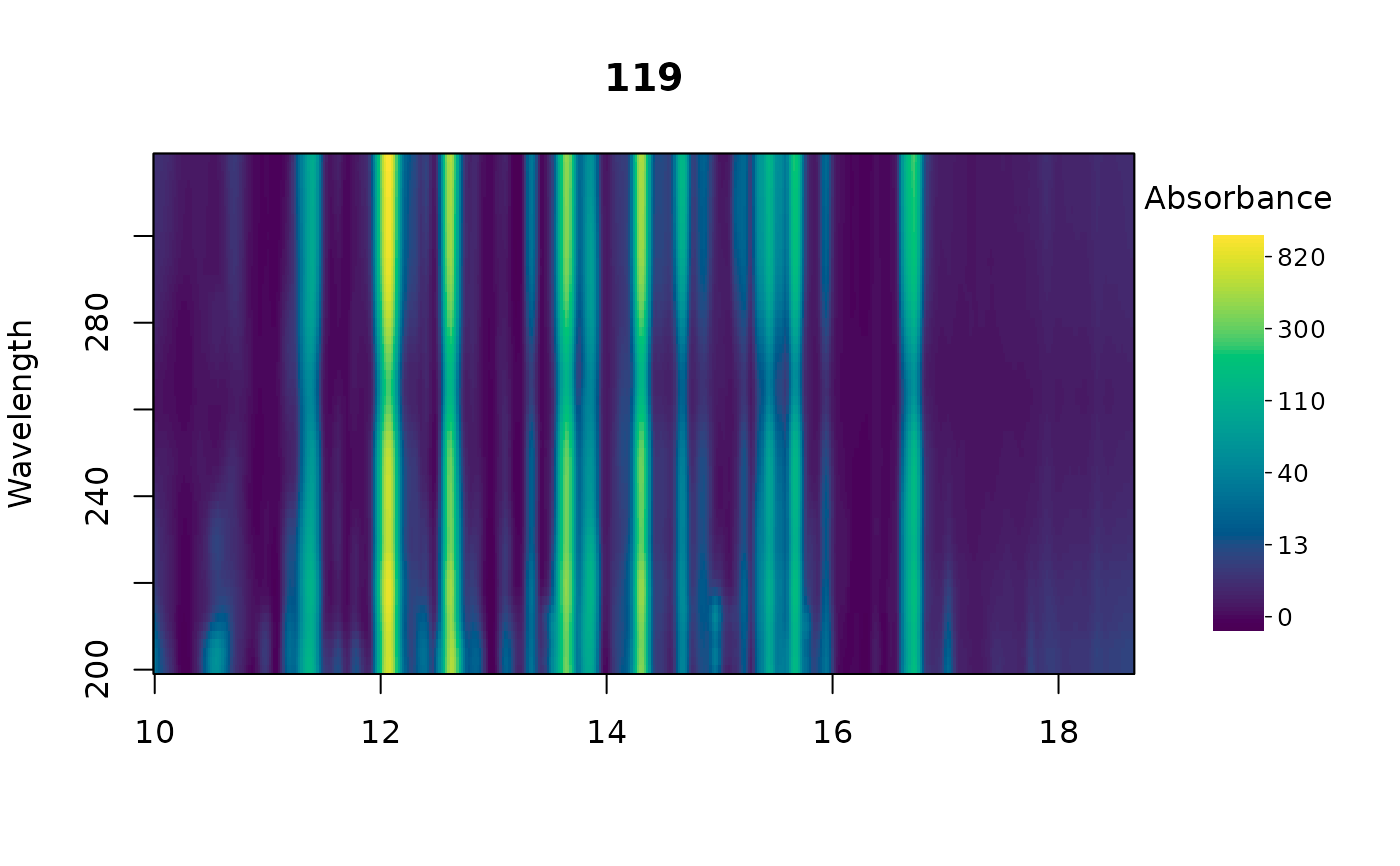
Plots a chrom_list, as returned by chromConverter::read_chroms(), as
traces (plot_chroms()), a heatmap of samples (plot_chroms_heatmap()),
or a contour plot of one sample (plot_chrom_contour()). If each sample
holds several elements, the "dad" element is plotted, or for
type = "traces" the one named by what.
Arguments
- x
A
chrom_listobject.- type
Type of plot:
"traces"(the default),"heatmap", or"contour".- ...
Arguments to the plotting function selected by
type.lambdasnames the traces to plot for"traces", and a single wavelength for"heatmap";idxselects samples for"traces"and"heatmap", and one sample for"contour".
See also
Other visualization functions:
boxplot.peak_table(),
mirror_plot(),
plot.matched_peak_list(),
plot.peak_list(),
plot.peak_table(),
plot_all_spectra(),
plot_chrom_contour(),
plot_chroms(),
plot_chroms_heatmap(),
plot_spectrum(),
scan_chrom()